

Analysts typically take the perspective of a buy-and-hold investor who has bought a single share, say in the S&P 500, to assess whether a stock is expensive or cheap. And then they use an off-the-shelf estimate of the future growth in dividends per share to back out the expected return from a valuation multiple such as the price/dividend ratio or the price/earnings ratio.
Right now, the cyclically adjusted P/E ratio on the S&P 500 is trading at 40.7, close to an all time high. By this metric, U.S. stocks look extremely expensive, and expected returns are low, especially compared to TIPS yields. Plugging in today’s numbers, you back out an expected real return of around 3% over the next decade, compared to a 10-year TIPS yield of 2.6%.
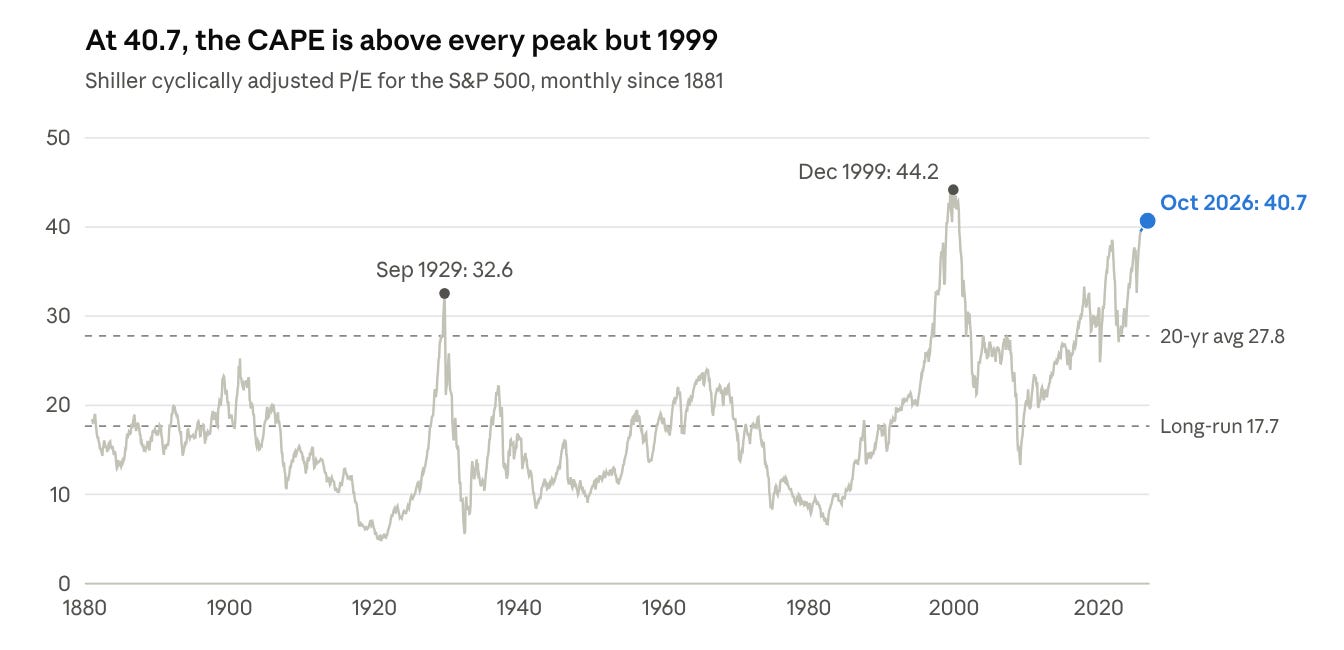
And the 3% estimate is generous. When the CAPE is high, it tends to revert back to some long-run average, and it’s stock prices that usually seem do all the work to get there.
But there’s a different approach to assessing whether corporate valuations make sense, as was recently emphasized in a series of innovative papers by Andy Atkeson, Fabrizio Perri and Jonathan Heathcote (AHP). Instead of an investor holding a single share, we could look at an investor who owns the entire corporate sector instead, all the equity, bonds and other liabilities. And it matters.
This investor acquired a claim to the corporate sector’s free cash flows (FCF), the total amount of cash that can be paid out to its owners, including its bondholders. You can think of the US corporate sector’s FCF as gross corporate value added left after paying workers, the government and after investment expenditures.
FCF = gross value added − compensation − taxes − gross investment.
And right now, there is a lot of cash left on the table after paying workers, the government and paying for corporate investment.
It is natural to compare the enterprise value (EV) of the corporate sector, the market value of all its liabilities, to its total FCF . The free cash flow yield is 3.26 percent, against a 1952-to-date average of 3.21 percent. That number is the 53rd percentile of its post-war history. Totally unremarkable. Put differently, you’re paying roughly 30 times FCF to own the corporate sector. That multiple is right in line with the historical average.
AHP emphasize that the US corporate sector’s EV has tracked 31 times FCF since 1952. The multiple is roughly constant, and their assessment holds up. If Shiller’s CAPE gives you vertigo, the steady EV/FCF multiple should offer some comfort.1
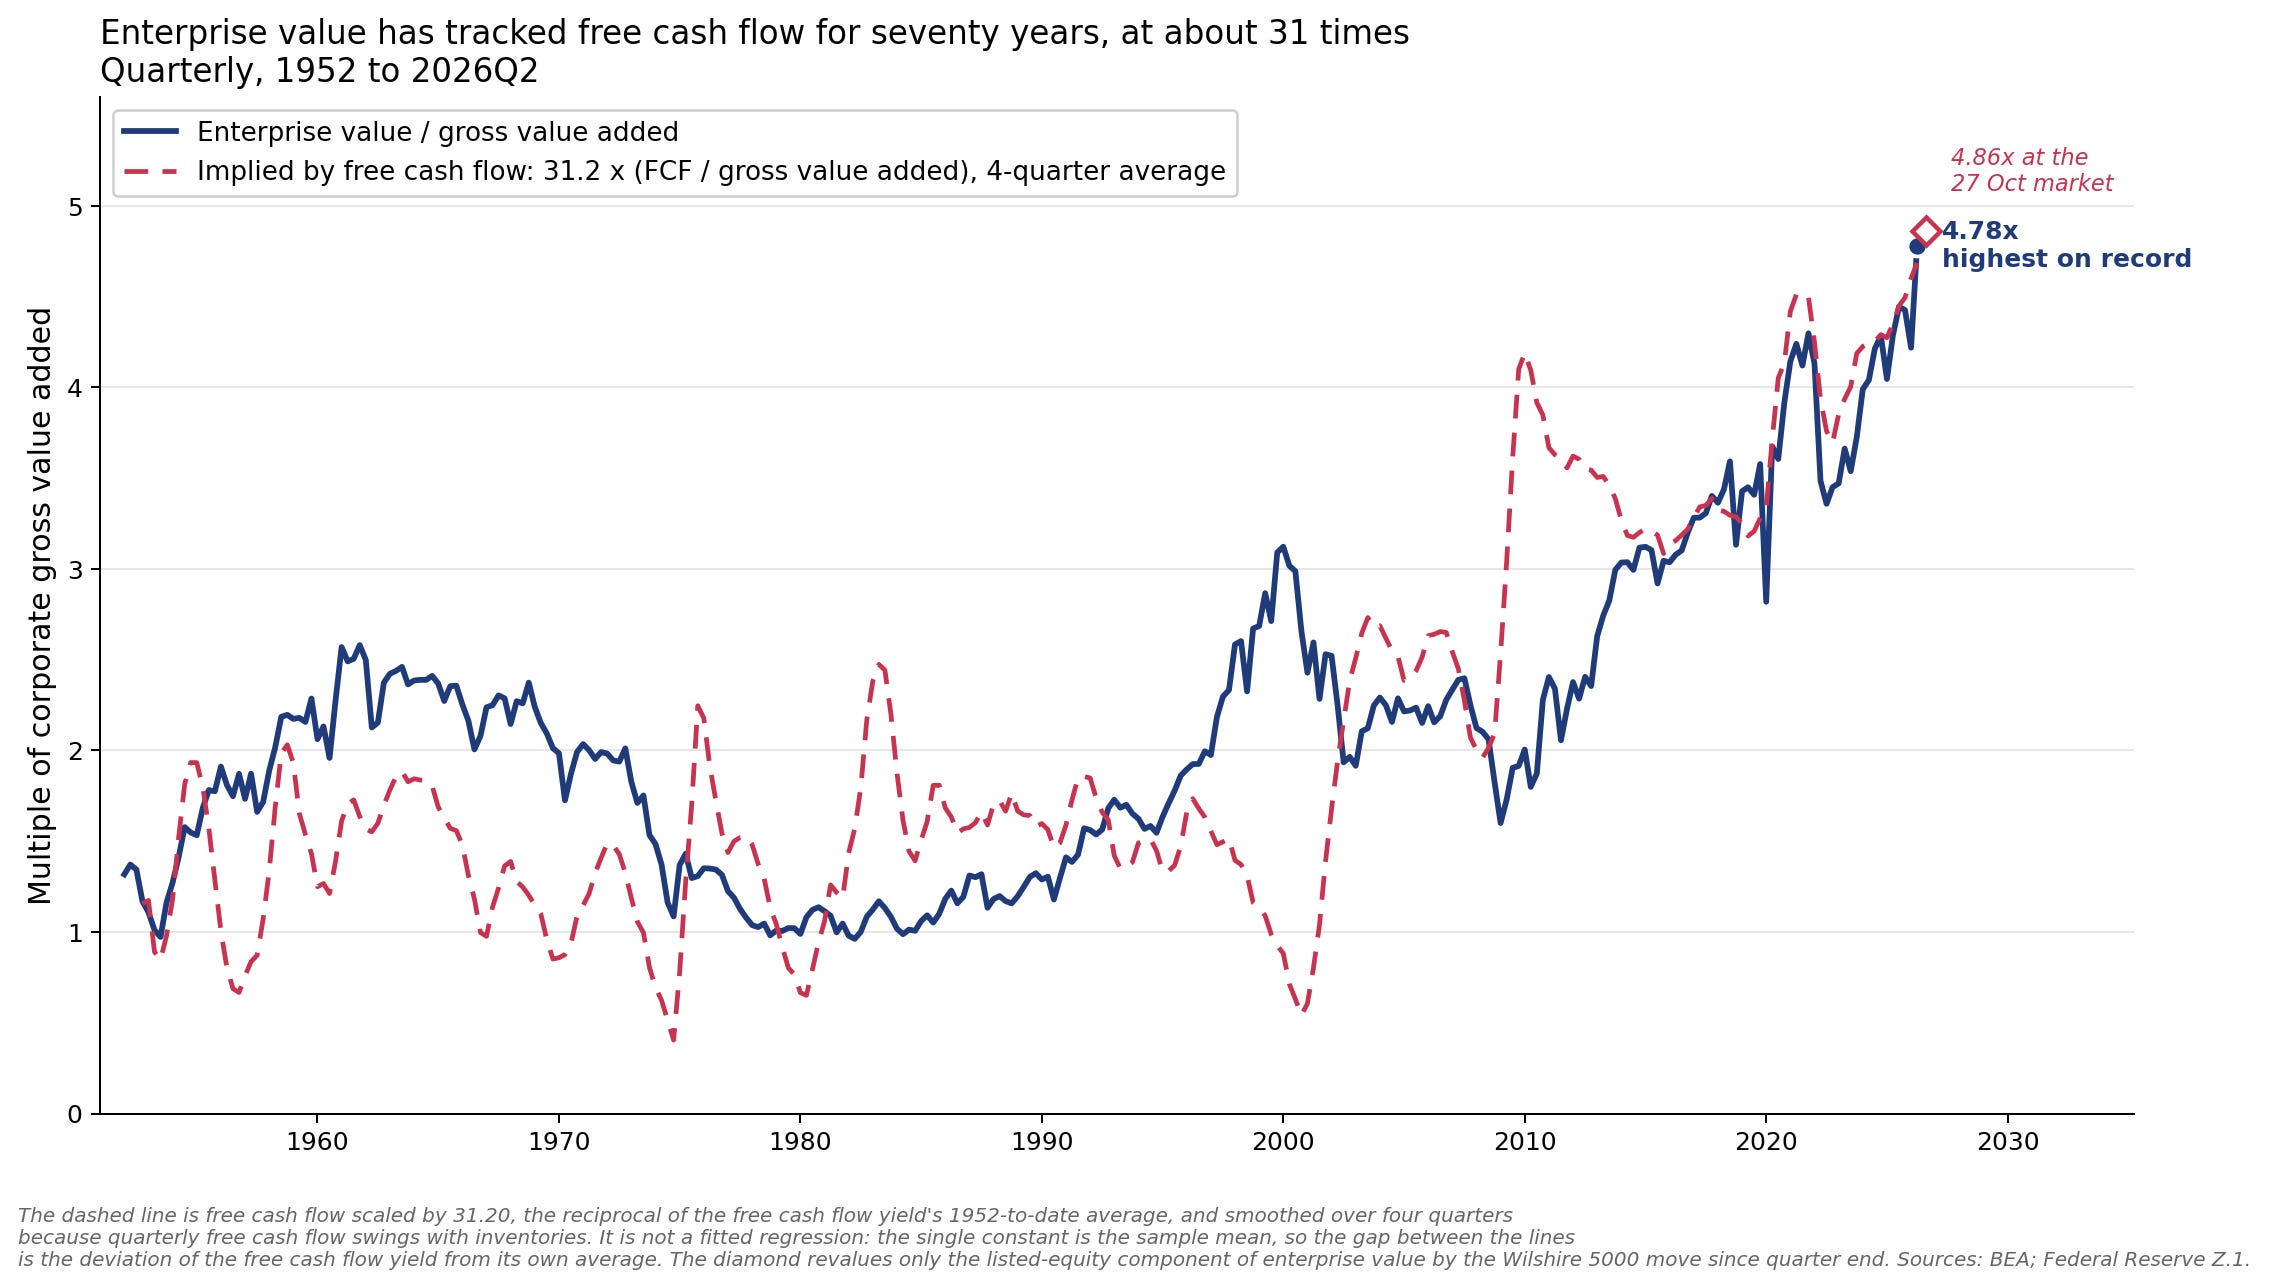
The picture changes again when you compare FCF to the sector’s value added (see blue line in chart). The current EV of the entire U.S. corporate sector is 4.78 times its annual gross corporate value added. That is the highest reading in US postwar history. What’s going on? The corporate sector is churning out record amounts of free cash flow as a fraction of the total value it creates. FCF is now about 15% of corporate value added.
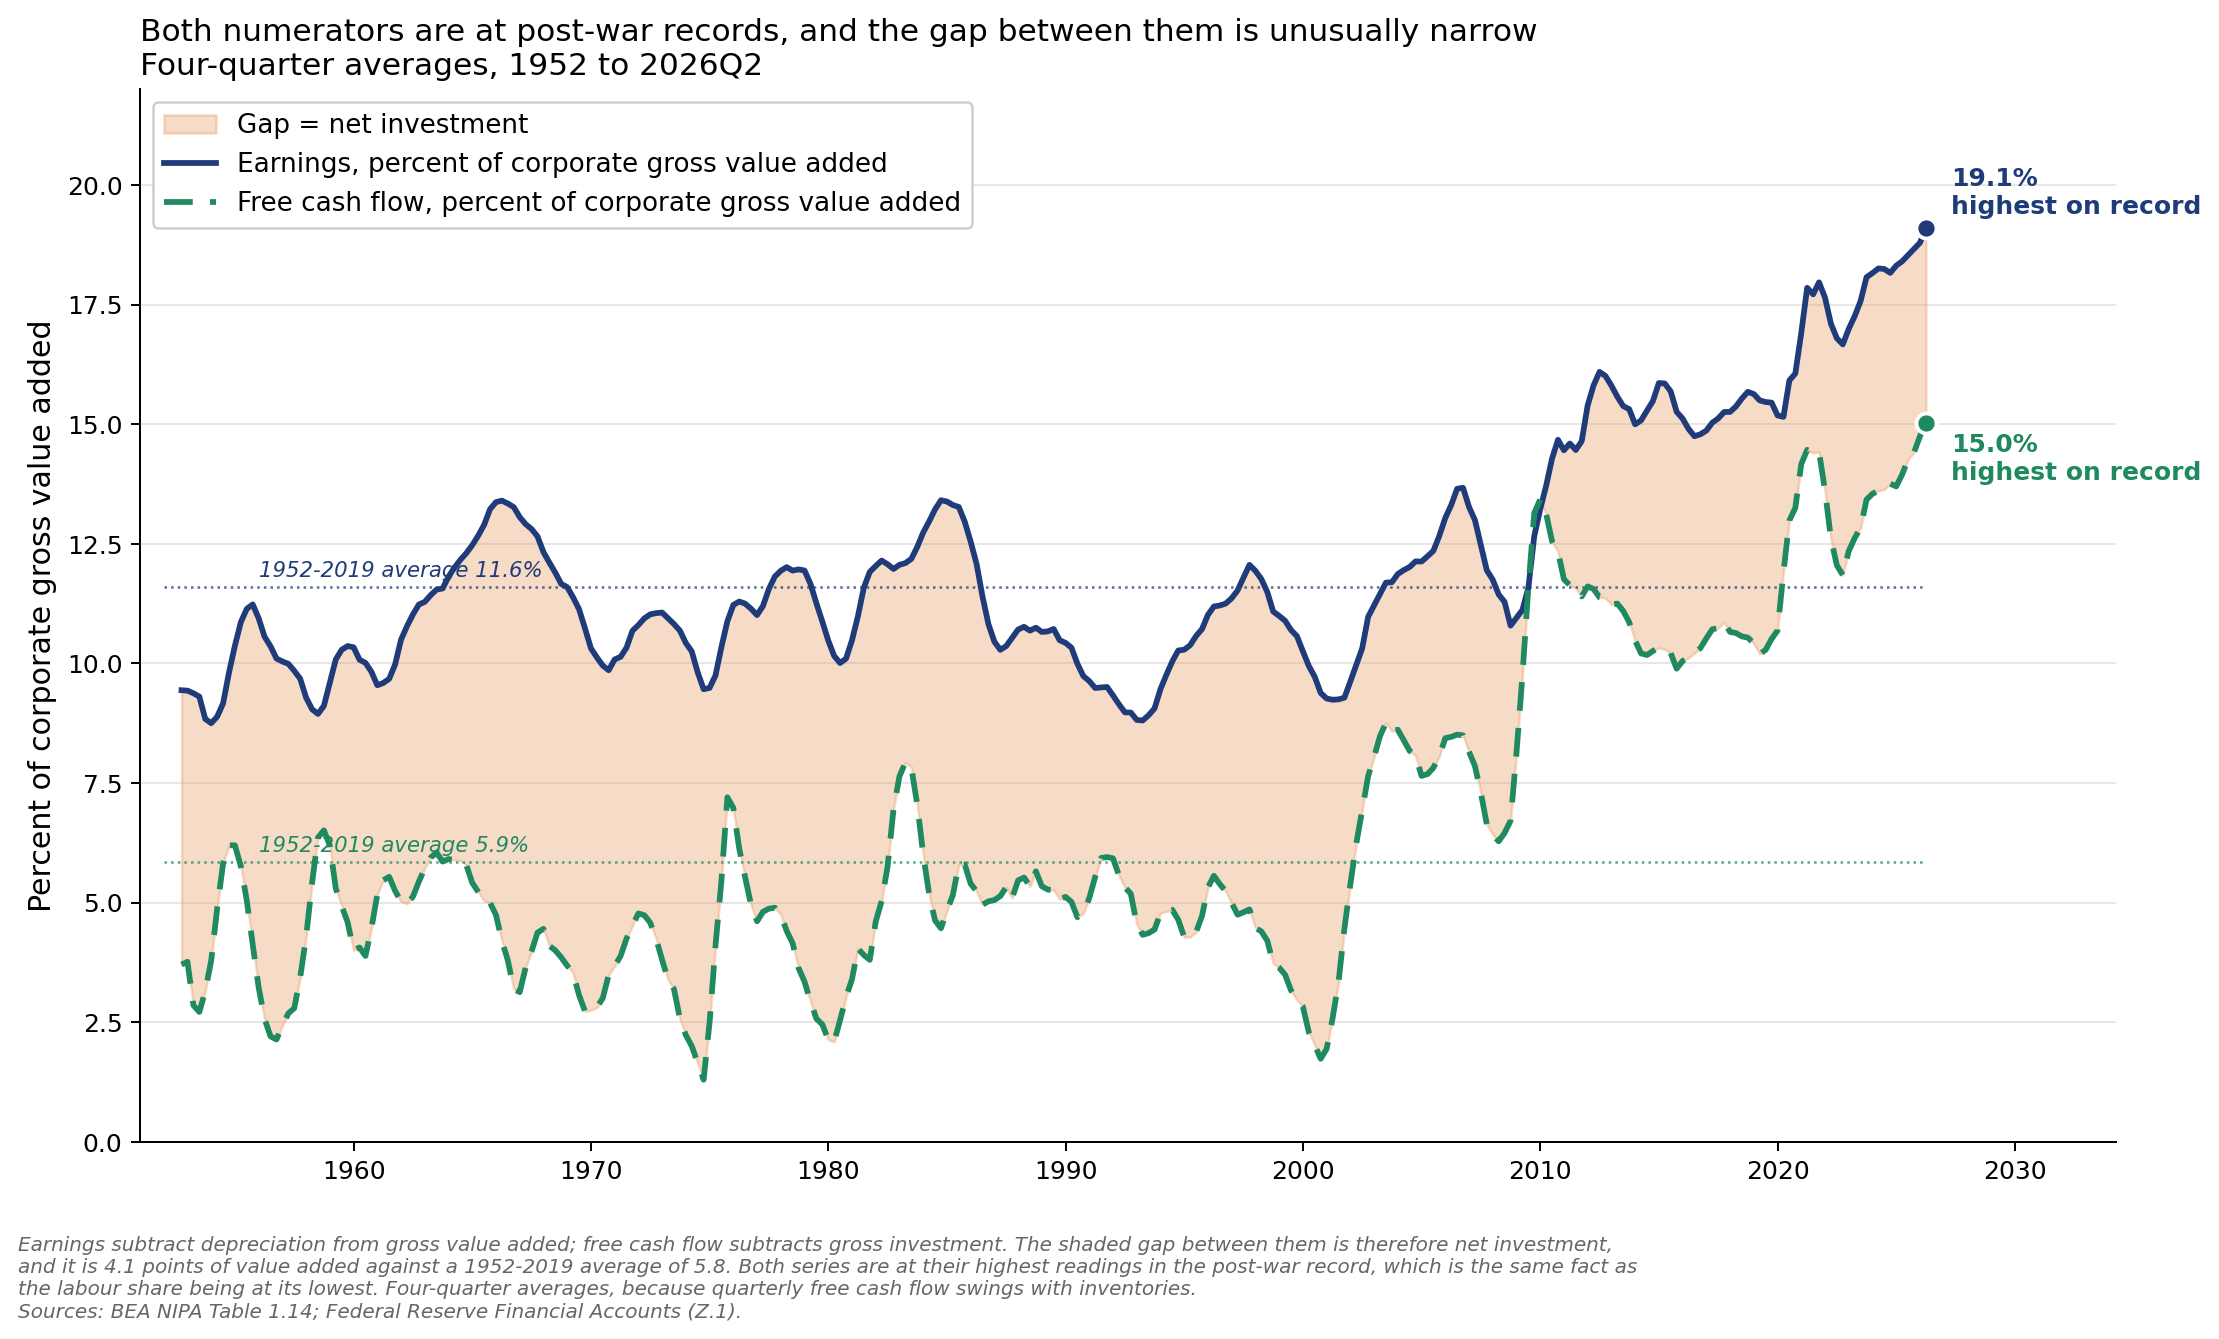
Earnings are what’s left of gross value added after paying workers, the government and accounting for depreciation (not investment).
Earnings = gross value added − compensation − taxes − depreciation
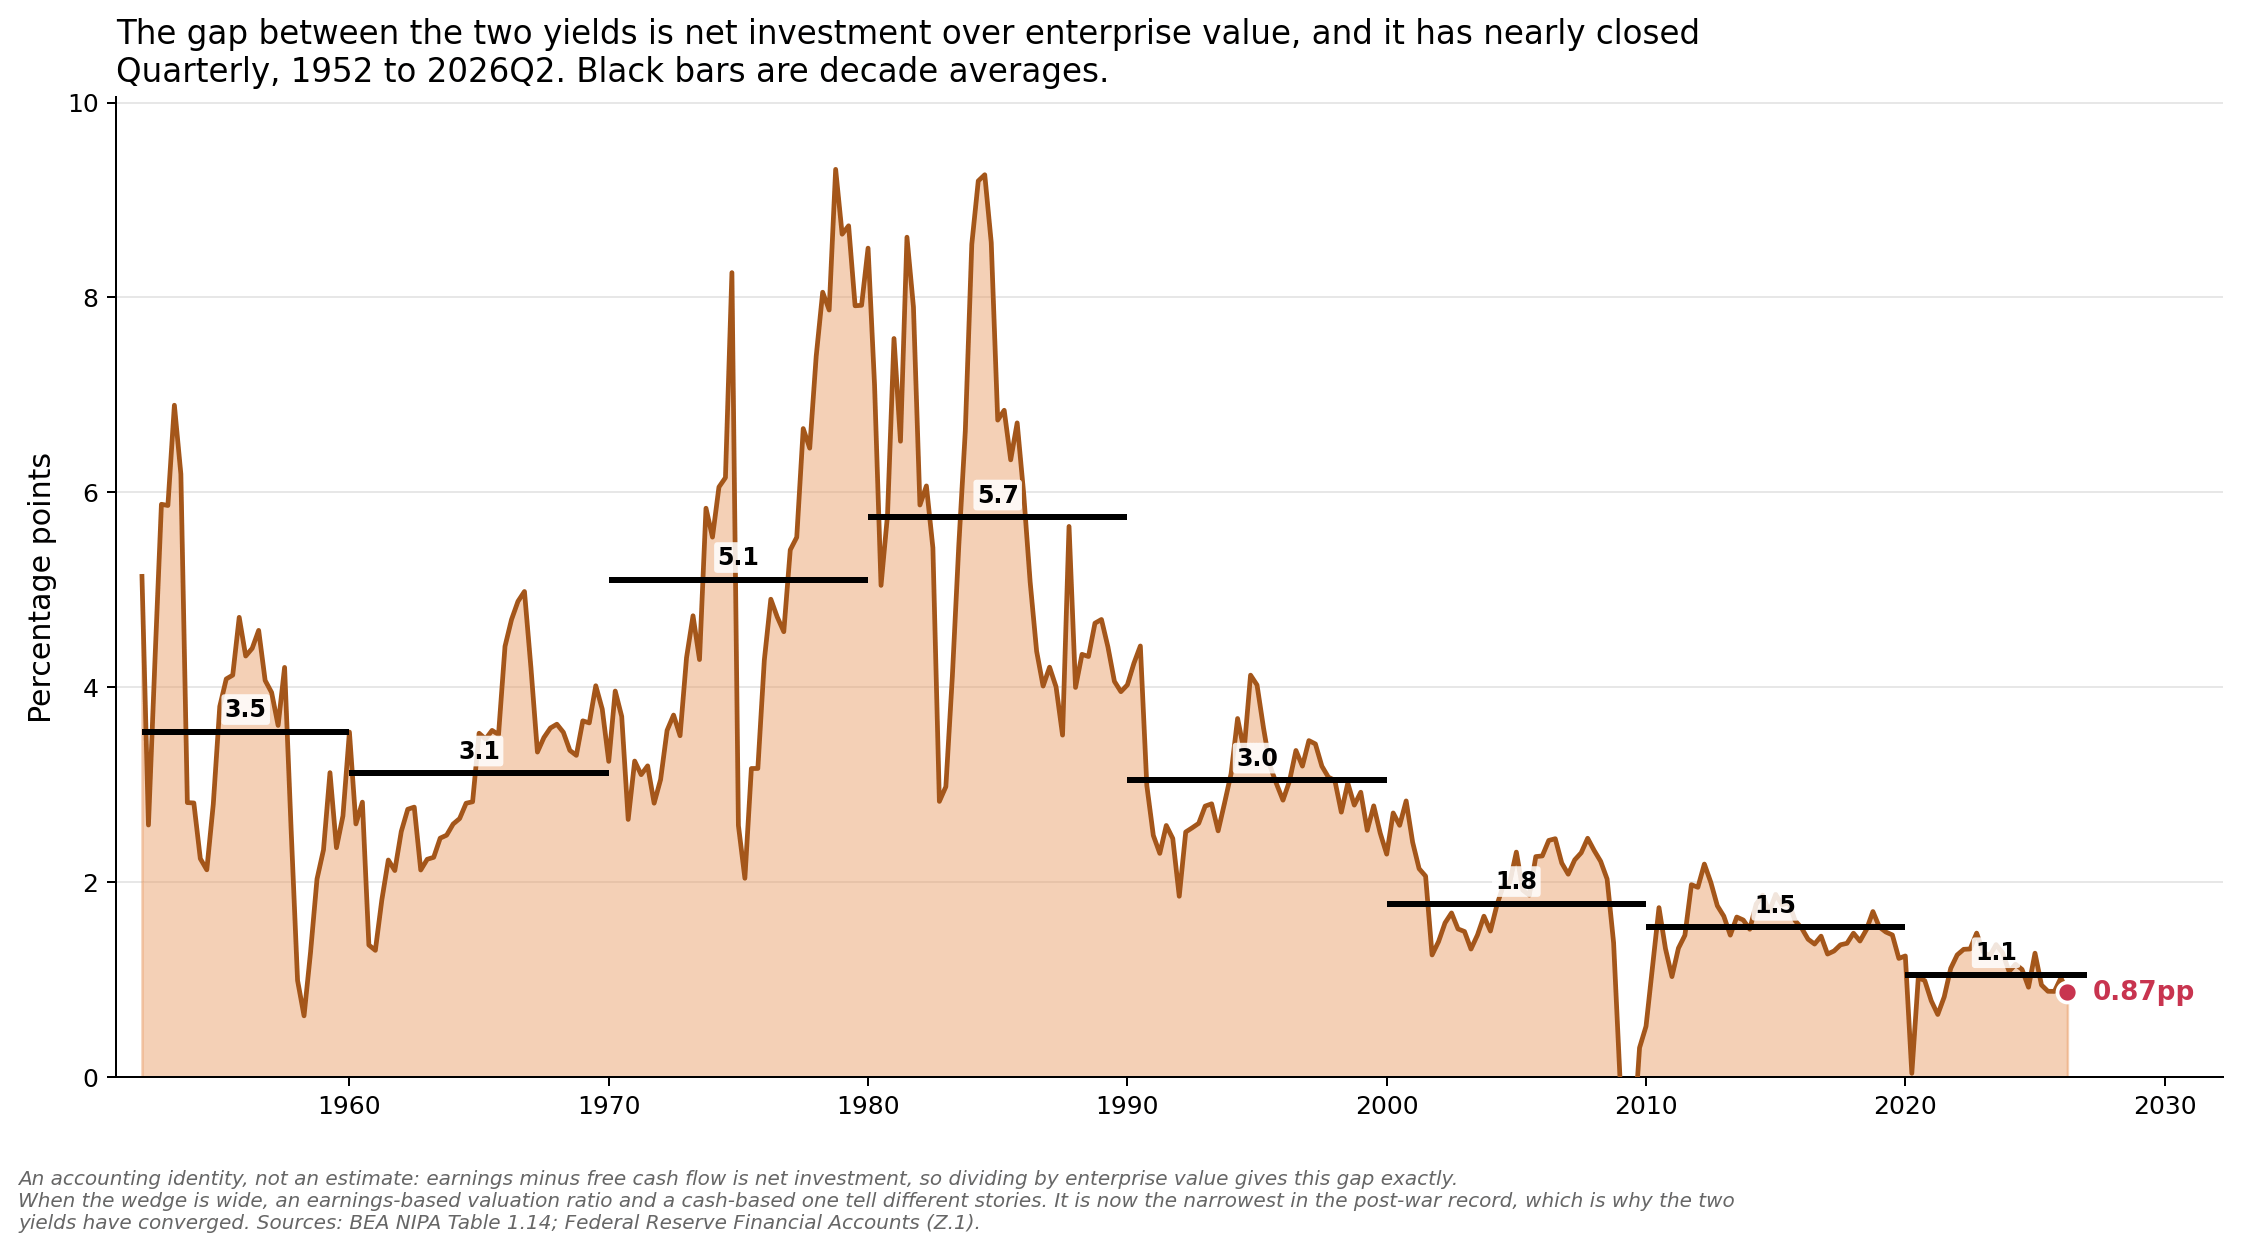
The difference between earnings and FCF is net investment. As the graph shows, the US corporate sector has invested significantly less over the past couple of decades than it used to.
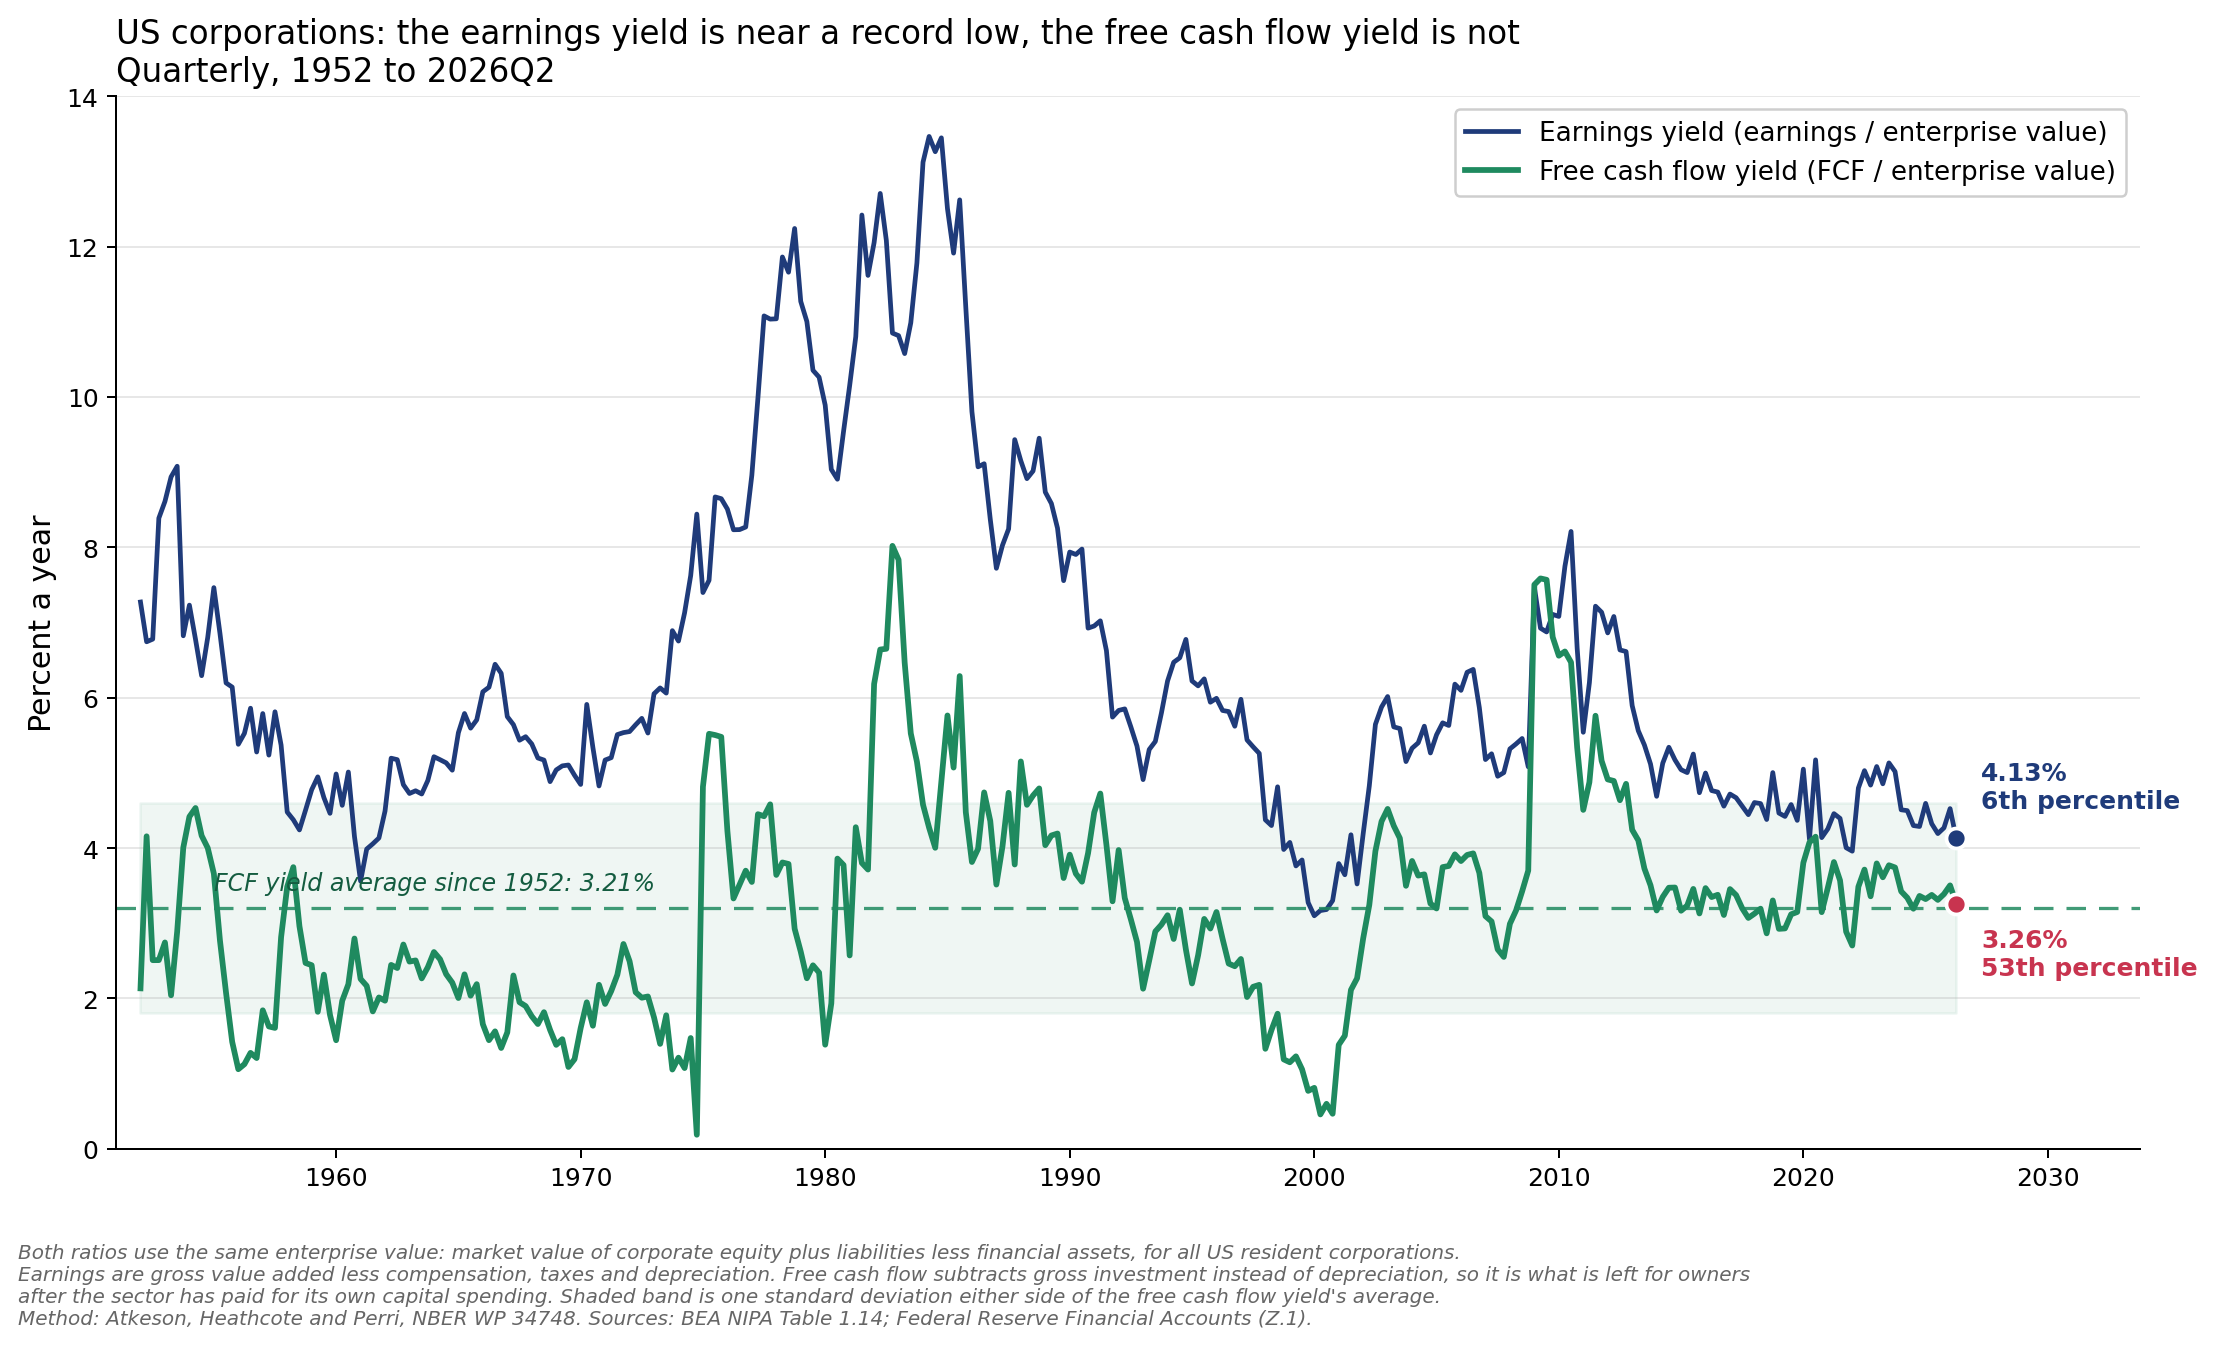
Its earnings yield is near a record low. Its FCF yield is not. Stocks look expensive when you look at earnings, but not when you look at cash flow, because corporations are now turning a much larger share of their earnings into cash for their investors. The wedge between the two yields is net investment divided by enterprise value. It has shrunk from well over 8 cents per dollar of value to less than one cent. Of the 4.13 cents in earnings per dollar of firm value, 3.26 cents can now be distributed to its owners.
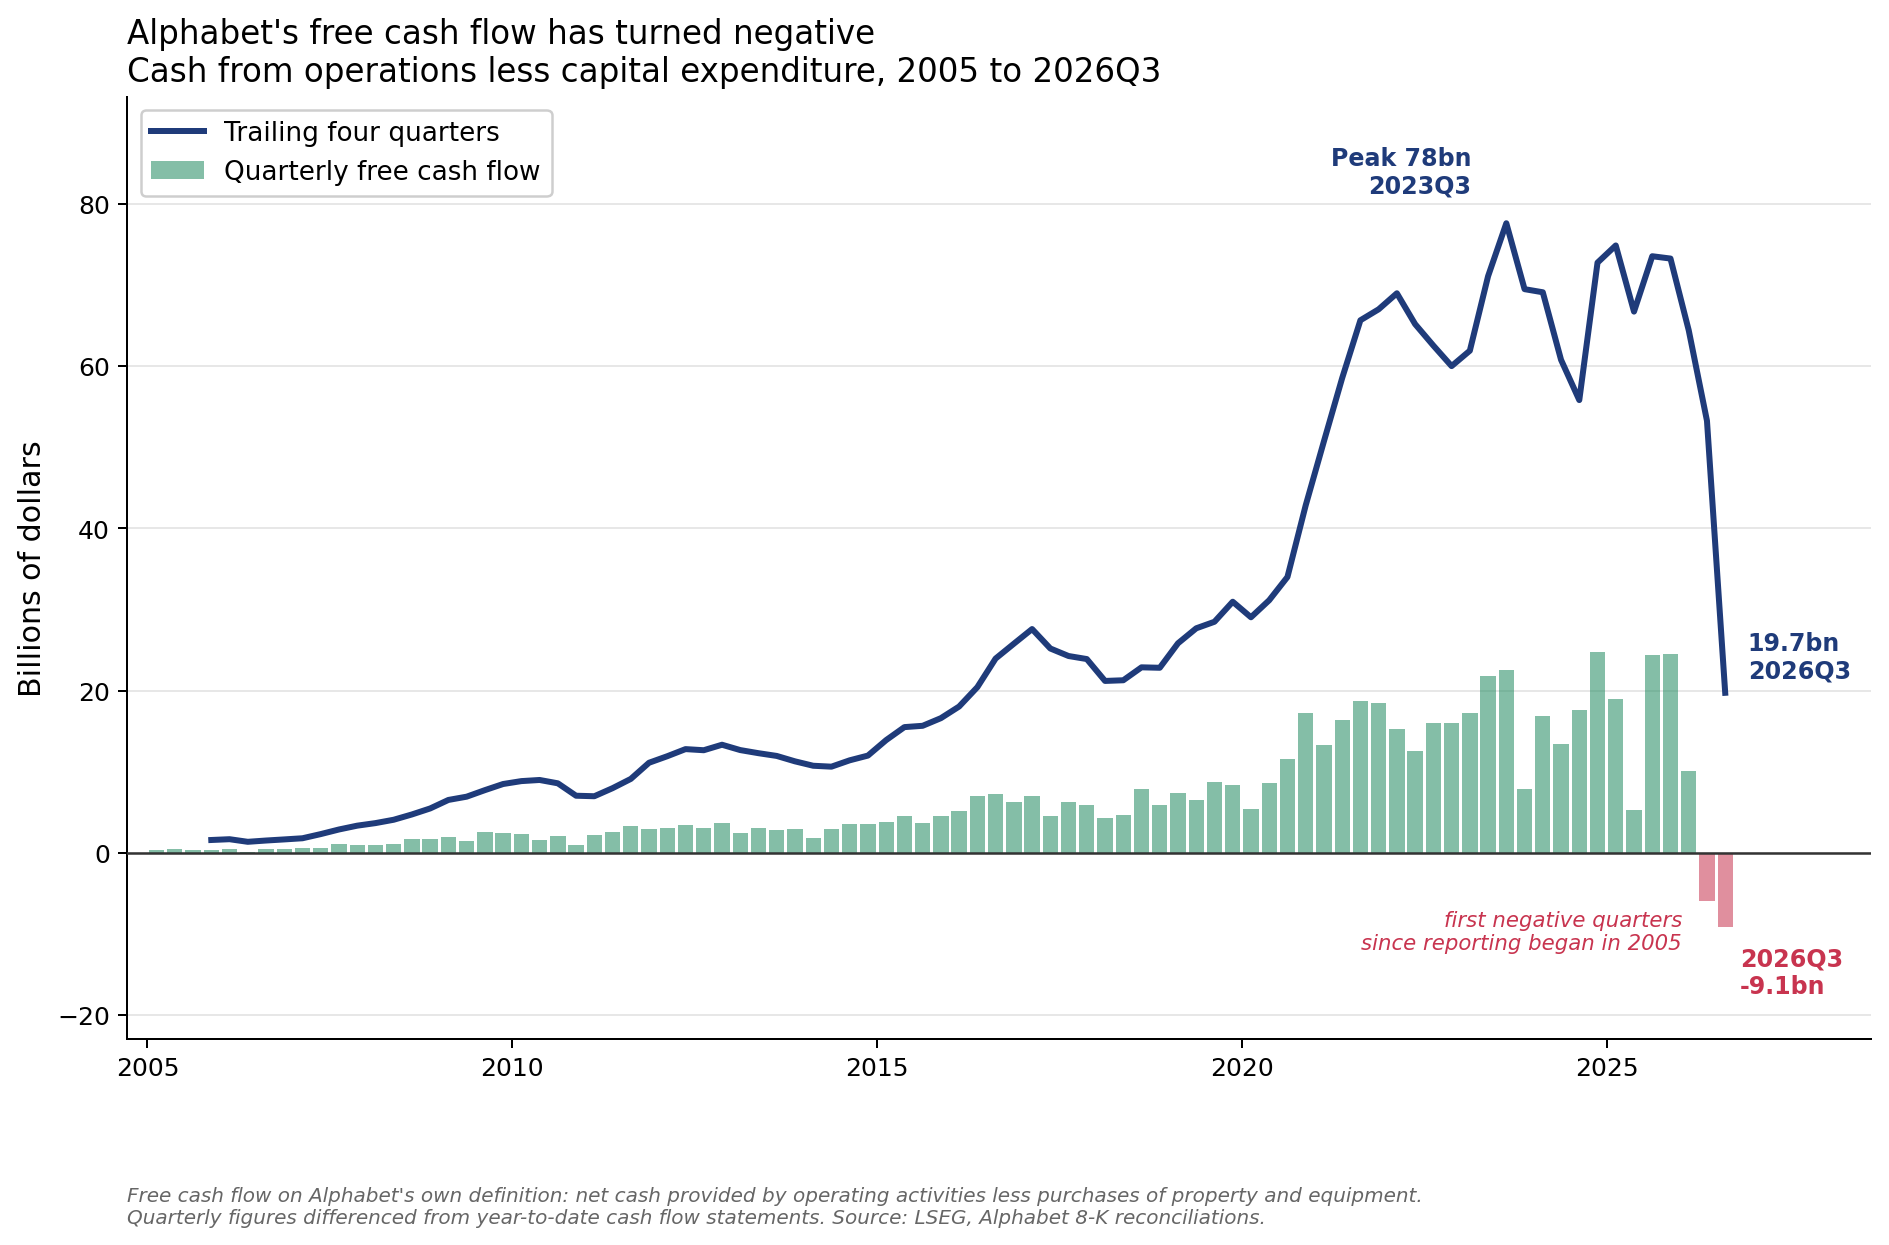
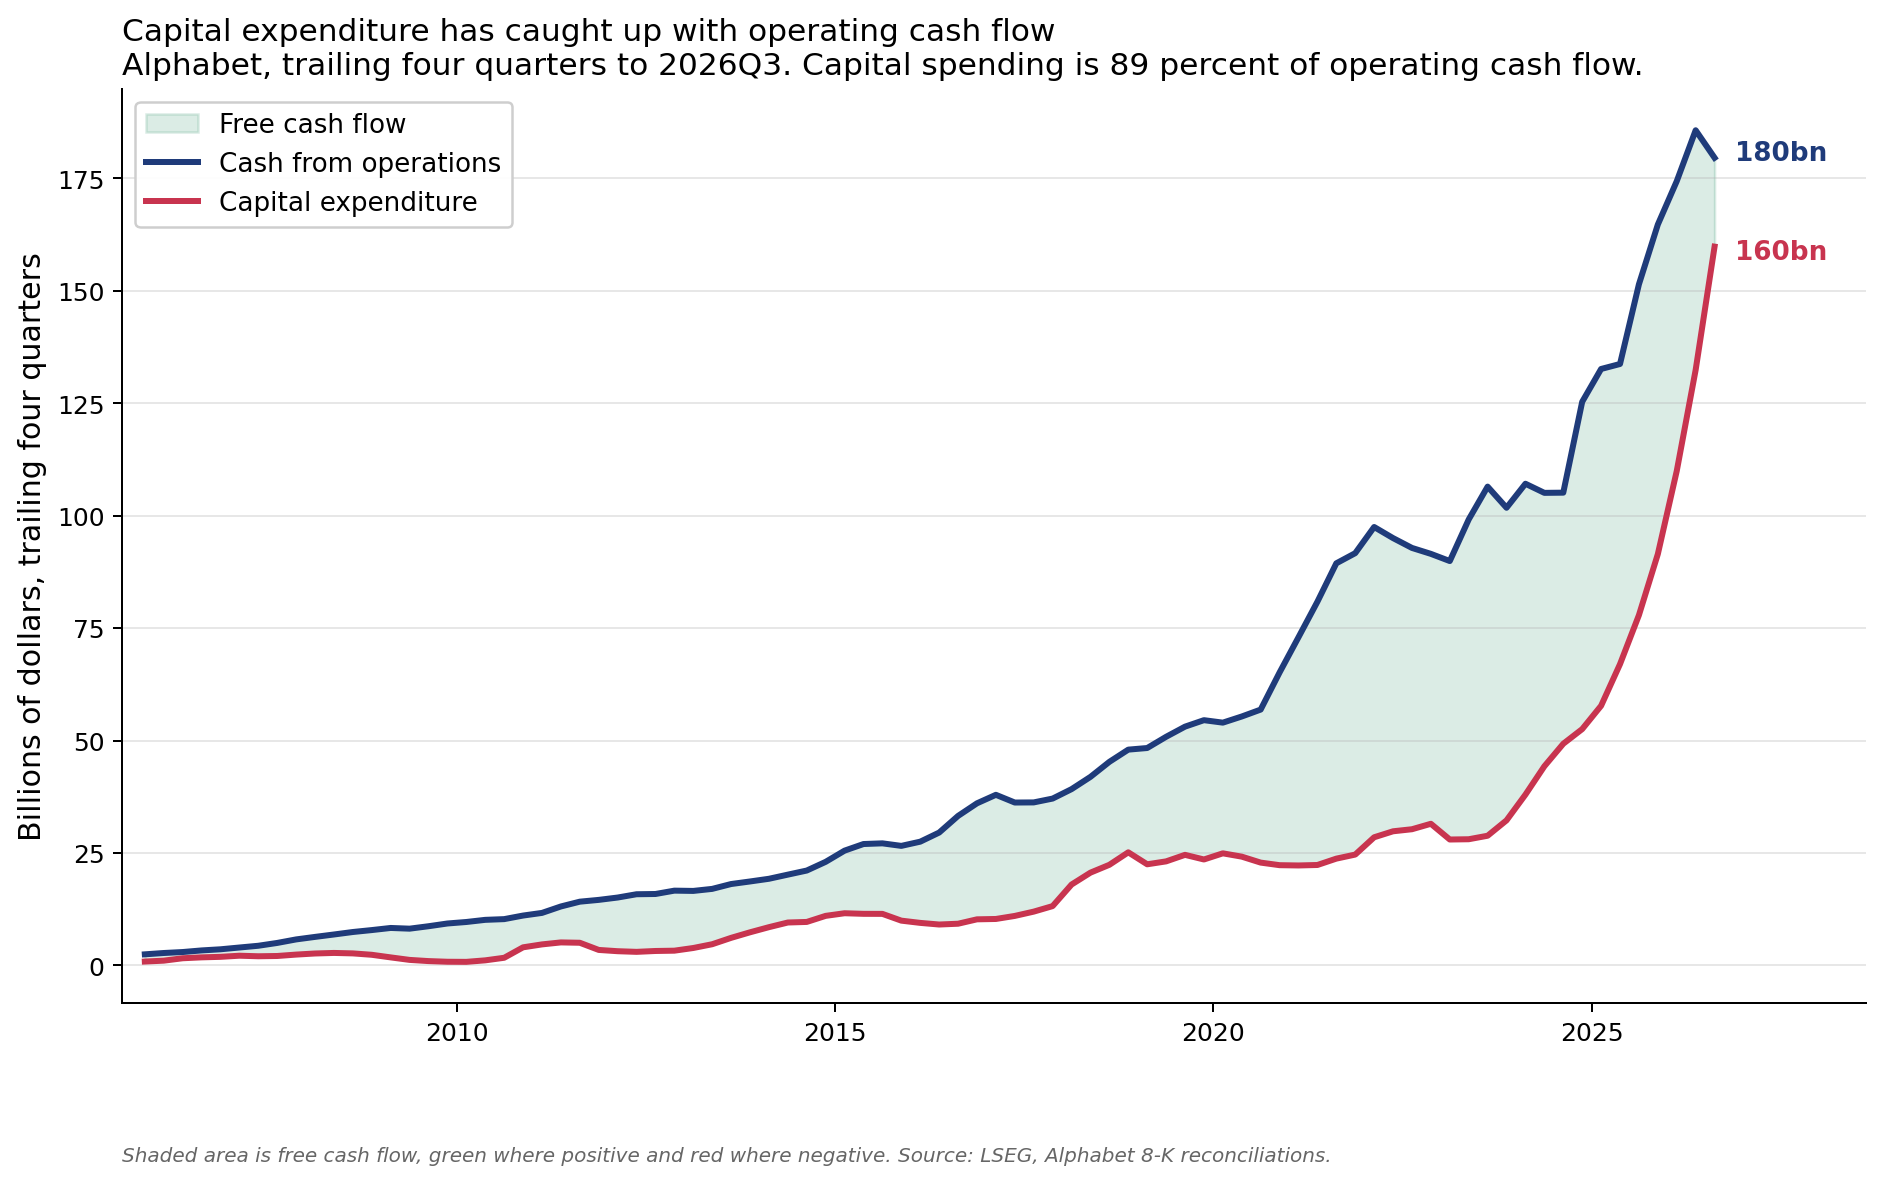
If you believe this pattern continues, even during the massive AI buildout, then you’re not too worried about the low earnings yield at current valuations.2 But it may not. This projected AI buildout dwarfs the investment booms in the railroads, the canals, and the telecom boom. Alphabet is exhibit A. It has just experienced its first two negative free cash flow quarters since it began reporting in 2005, as a result of massive investments in AI infrastructure, not as a result of a decline in its earnings.
What does all of this imply for expected returns? Let’s take the FCF yield of 3.26 percent and hold the multiple fixed. Your annual return is that yield plus the growth of free cash flow. Assume that FCF grows with nominal output, which means that FCF as a percentage of gross value added stays at its record level of 15% forever.3 That delivers an approximate real expected return of 5.3%. This is the return on debt plus equity, but total leverage is small. That is a decent return, but below what US corporate capital has historically delivered. The record cash flow scenario is the baseline scenario that gets you an OK outcome as an investor.4
US corporations are currently generating unprecedented amounts of cash for their investors. But even if you compare free cash flows to enterprise value, this time would have to be different in order for investors to earn a typical return on equities. Holding the FCF constant as a fraction of total value added at its record level delivers a below-average return.
To earn the historical average, you’d have to believe that the share keeps climbing. Basically, you’re betting on a structural transformation of US capitalism favoring capital at the expense of labor.
References
Atkeson, Andrew, Jonathan Heathcote, and Fabrizio Perri. 2026. “A Macroeconomic Perspective on Stock Market Valuation Ratios.” Federal Reserve Bank of Minneapolis Staff Report 682; NBER Working Paper 34748. Forthcoming, American Economic Review: Insights. https://www.nber.org/papers/w34748
Atkeson, Andrew, Jonathan Heathcote, and Fabrizio Perri. 2025. “Reconciling Macroeconomics and Finance for the U.S. Corporate Sector: 1929 to Present.” Federal Reserve Bank of Minneapolis Staff Report 665; NBER Working Paper 33459. https://www.minneapolisfed.org/research/staff-reports/reconciling-macroeconomics-and-finance-for-the-us-corporate-sector-1929-to-present
Campbell, John Y., and Robert J. Shiller. 1998. “Valuation Ratios and the Long-Run Stock Market Outlook.” Journal of Portfolio Management 24 (2): 11–26.
If they’re right, that’s a major challenge to the conventional wisdom in financial economics that high multiplies in the stock market simply mean low future returns, not high growth.
Analysts seem to think it will continue. They project an increase in the FCF share of value added from 15% to 20% by 2029 if you use the CBO projections for GDP growth. That number uses FCF projections from I/B/E/S consensus EBITDA and capital expenditures, anchored on the realised Compustat aggregates.
The Survey of Professional Forecasters projects 4.58 percent nominal GDP growth over ten years and inflation of 2.5%.
Part of the gap between the 5.3% expected return on the entire corporate sector and the 3% expected return implied by the S&P 500’s valuation may reflect the contribution of new entrants. Aggregate corporate cash flow growth includes the growth of new firms. But an investor who buys the S&P 500 today does not participate in the growth of these firms before they enter the index. By the time they join, much of that growth is already reflected in their market valuations. Aggregate corporate cash flows can therefore grow faster than the cash flows accruing to S&P 500 investors.
Taxes are SLASHED due to OBBBA 100% depreciation on the datacenter buildout. That bill will come due on the national debt, only later. For now that increases cash flow, becauses the tax reduction is RUNNING AHEAD of investment. We are literally putting the upper leg of this K shaped economy on the national debt.
The strongest part of this framework is that it relocates the valuation debate from multiples to distribution. A normal EV-to-free-cash-flow ratio looks reassuring only because free cash flow already captures a record share of corporate value added. Sustaining historical equity returns from here is therefore a bet not merely on growth, but on capital continuing to gain at the expense of labor and reinvestment.